started about 16/02/2026
This is a followup to JEE Mains, so before I could try to fill the gap of pre-2019 years, I decided to experiment atleast the more-reliable datapoints (2019 onwards) with another entrance examination I’m sure you have heard which is: MET
I used the dataset I had manually sourced from CollegePravesh site for this task to finally prove how much of an impact JEE had on other entrances for any year, so I started working on it with JEE dataset I just published online. So… you can tell I am curating a LOT of datasets at this point.
data_path = "data/"

# I am excluding 2025's data since it involves merger of CS-branches.

years = [2021, 2022, 2023, 2024]
all_data = []

for year in years:
	year_dir = os.path.join(data_path, str(year))
	if os.path.exists(year_dir):
		for file in os.listdir(year_dir):
			if file.endswith(".csv"):
				df = pd.read_csv(os.path.join(year_dir, file))
				df['year'] = year
				all_data.append(df)
df_manipal = pd.concat(all_data, ignore_index=True)
I attempted finding a relation between Manipal’s CS-Core (the most-prestigious branch in main campus) with all years of JEE between 2021-2024, I could only find proper values from 2021 for manipal (also I’m kindof lazy) but yea the exclusion of 2025 was solely because of the merging of CS-specs like AI/ML, Cybersec, IT etc. being merged to one common “CS-Core” branch so it would unnaturally make it look like CS-Core cutoffs increased massively in 2025 if we exclude context.
Main aim for me was to find whether:
- Amount of candidates appearing in JEE exam in this time period decreased cutoffs of this branch by any way
- If increase/decrease of JEE mains particularly general category had any effect on cutoffs
- And if increase in IIT Seats over the years (it has doubled since 2013) has also had any impact on the cutoffs
So I accordingly prepared a dataframe for JEE as well to find it:
df_mains = pd.read_csv(os.path.join(data_path, "students_count.csv"))
df_mains = df_mains.rename(columns={
	'Registered': 'mains_registered',
	'Appeared': 'mains_appeared'
})

df_adv = pd.read_csv(os.path.join(data_path, "advanced.csv"))
df_adv = df_adv.rename(columns={
	'Registered': 'adv_registered',
	'Appeared': 'adv_appeared',
	'Eligible': 'adv_eligible',
	'Qualified': 'adv_qualified',
	'IIT Seats': 'iit_seats'
})

df_adv.columns = df_adv.columns.str.strip()
df_perc = pd.read_csv(os.path.join(data_path, "percentile.csv"))
df_perc = df_perc.rename(columns={
	'General': 'general_cat',
	'EWS': 'ews',
	'OBC': 'obc',
	'SC': 'sc',
	'ST': 'st',
	'PwD': 'pwd'
})

df_jee = pd.merge(df_mains, df_adv, on='Year', how='inner')
df_jee = pd.merge(df_jee, df_perc, on='Year', how='inner')
df_jee = df_jee[(df_jee['Year'] >= 2021) & (df_jee['Year'] <= 2024)]
time to merge them on basis of yearly periods and find correlations
after some fancy-styling in seaborn and finding a heatmap, this was the result I got:
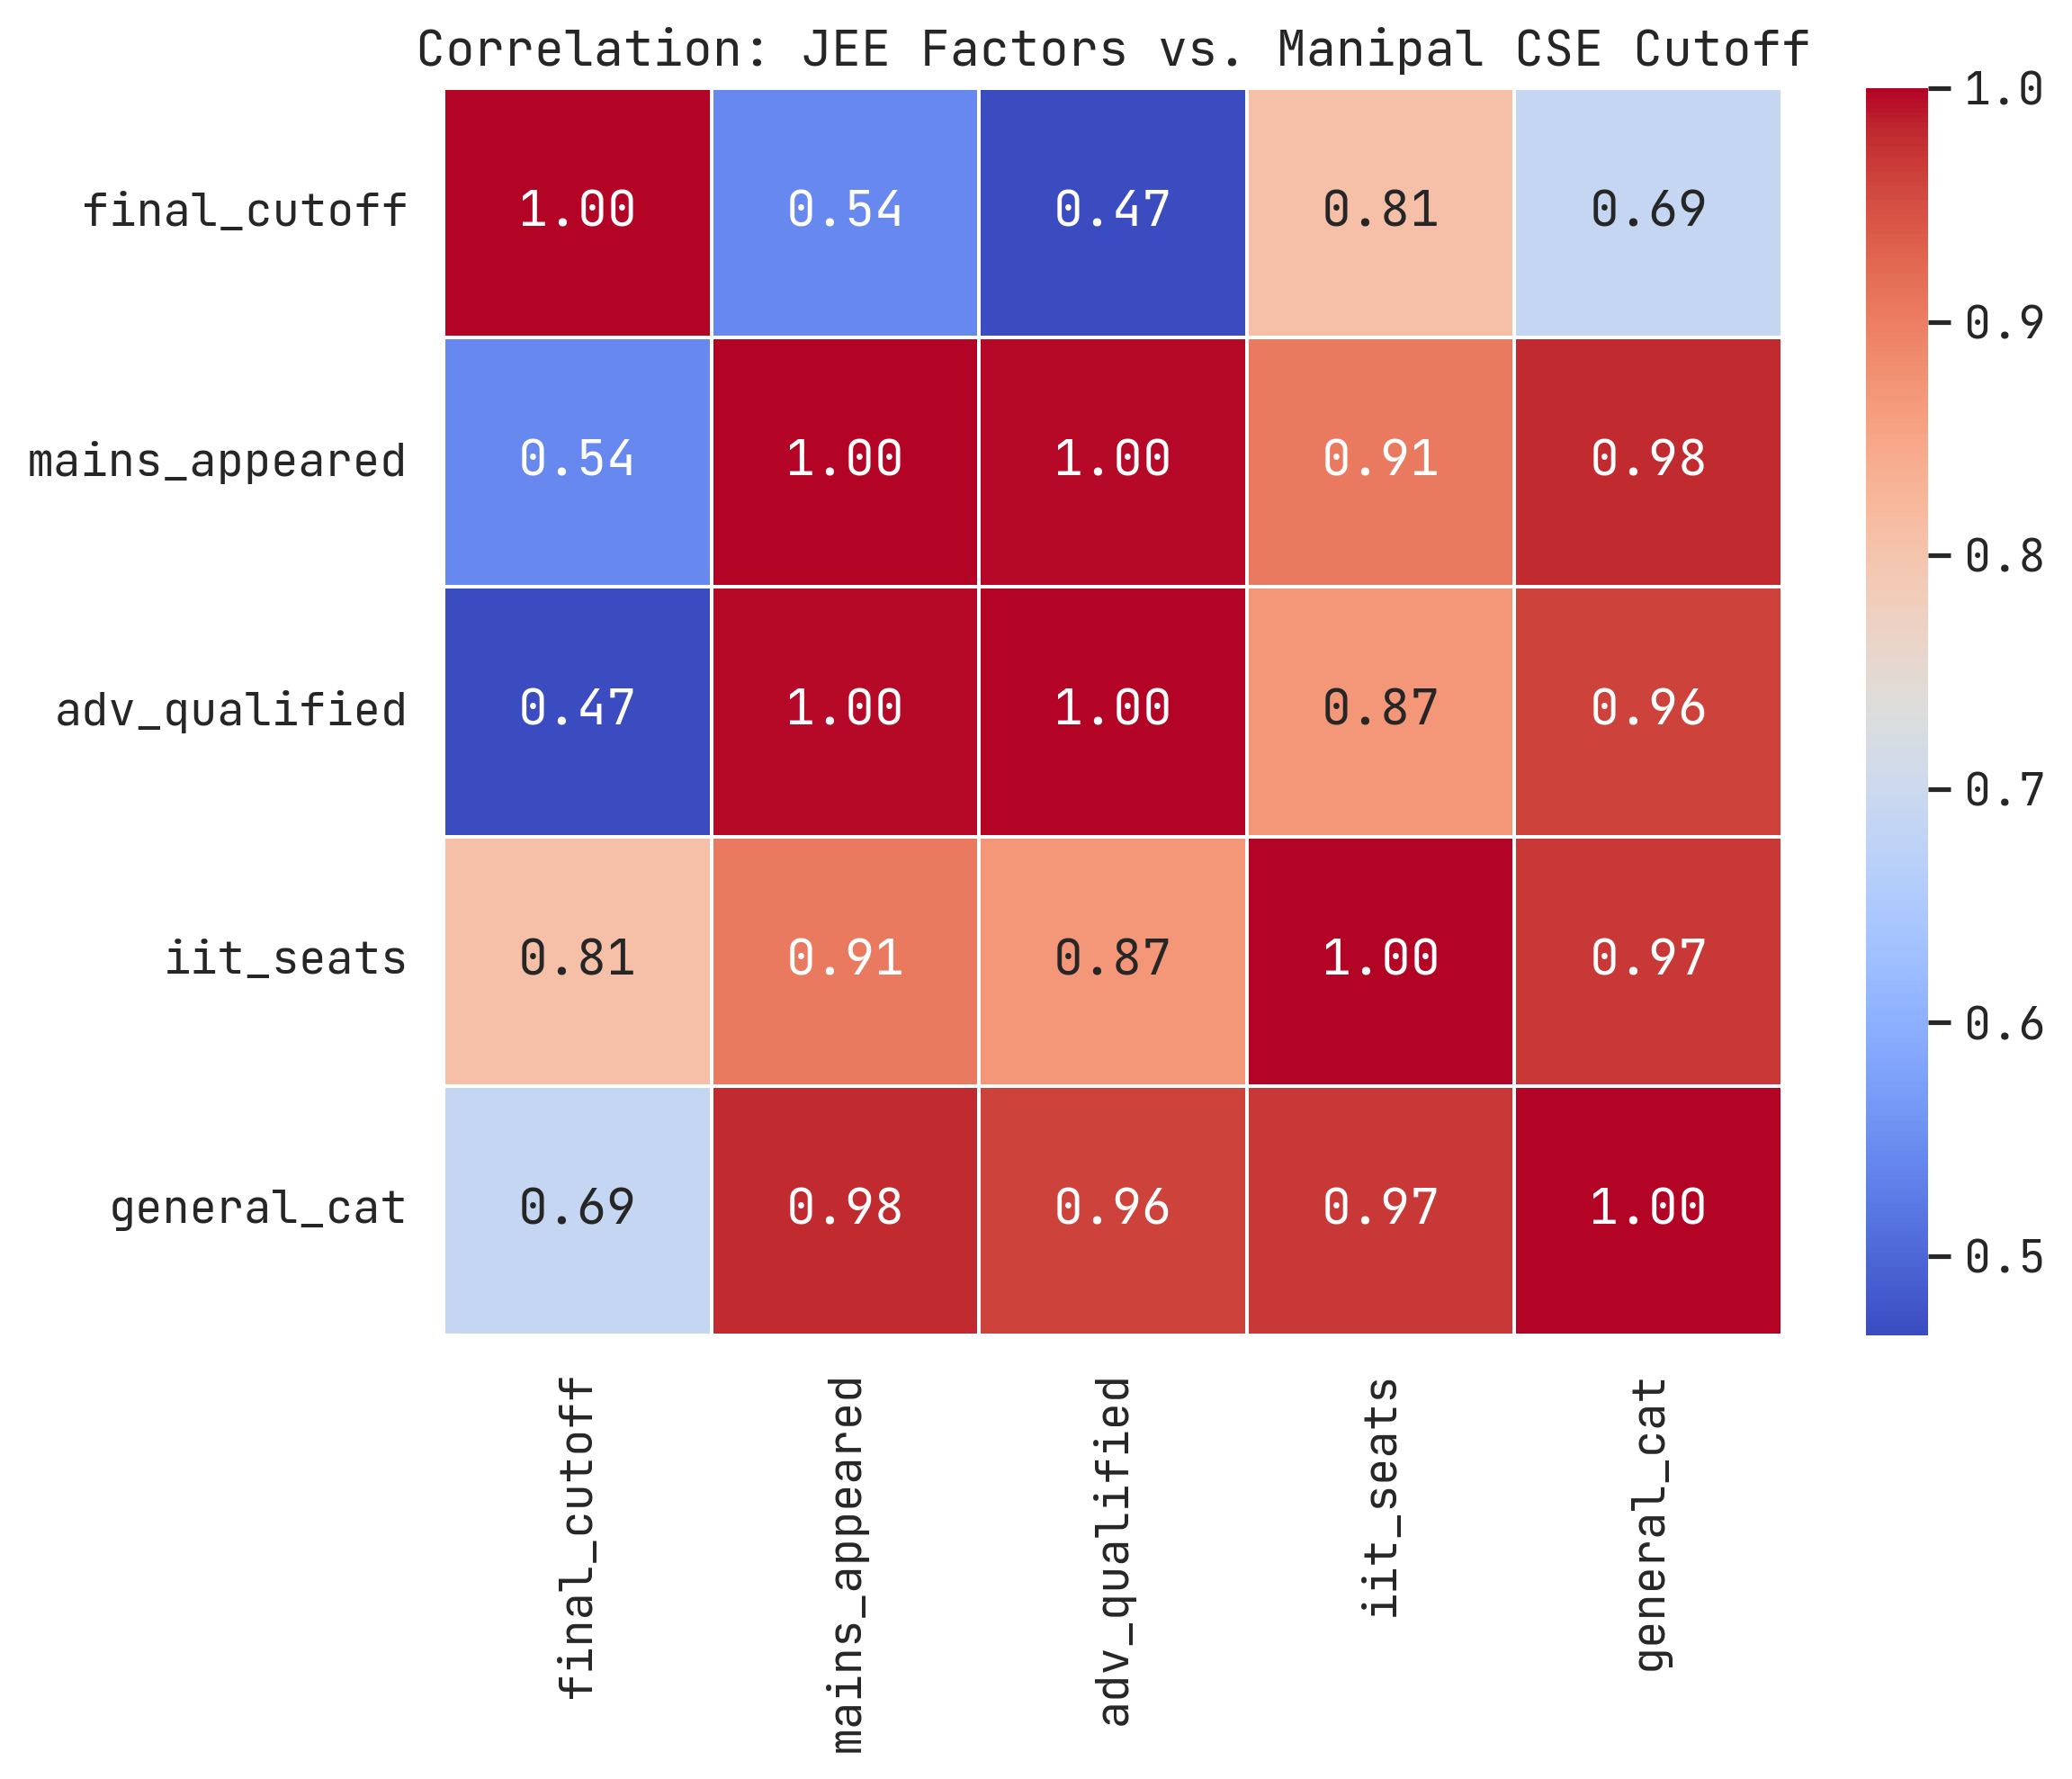
The principal diagonal is supposed to 1.0 (it just means that the feature maps to itself) so ignore that anyways…
I don’t know how to feel about this but apparently IIT-seats increase has an impact of ‘0.81’ which is a major factor which I hadn’t expected but makes sense as IIT is by far the most prestigious college in India and people would pick IIT core branch over Manipal CS usually and seat intake increasing by twofolds in the past 12 years does have a role in that.
So as far percentile for general-category is concerned: with increase of mains-cutoff → the Manipal CSE cutoff also tends to rise. Which is quite interesting and I genuinely have no remarks for that.
NOW WHAT SPURNED ME OFF WAS THE FACT THAT NUMBER OF APPEARING CANDIDATES DIDN’T PLAY THE MAJOR FACTOR THAT I HAD INITIALLY EXPECTED TO HAVE HAD
So if we were to find the impact of this, lets see it, shall we?
def calculate_impact(independent_var, var_name, scaling_factor):
"""
Fit a linear regression model
"""

X = cse_data[[independent_var]]
y = cse_data['final_cutoff']

model = LinearRegression()
model.fit(X, y)
coef = model.coef_[0]

print(f"Impact of {var_name}")
print(f"For every {scaling_factor:,} unit increase in {var_name},")
print(f"the Manipal CSE cutoff shifts by approximately: {coef * scaling_factor:.0f} ranks\n")
the scaling factor acts as a means to check with each “Z” units of a “VAR_NAME” (here the factor that is being taken in account of) how much did it result in a shift in Manipal CSE cutoffs
calculate_impact('mains_appeared', 'JEE Main Candidates', 100000)
calculate_impact('general_cat', 'General Percentile Cutoff', 1.0)
calculate_impact('iit_seats', 'Total IIT Seats', 500)
since there are a lot of mains-candidates appearing each year, lets check for each 1-lakh students increase how much would it affect, similarly for each 1%ile increase & 500 seats in IITs
Impact of JEE Main Candidates For every 100,000 unit increase in JEE Main Candidates, the Manipal CSE cutoff shifts by approximately: 100 ranks

Impact of General Percentile Cutoff For every 1.0 unit increase in General Percentile Cutoff, the Manipal CSE cutoff shifts by approximately: 120 ranks

Impact of Total IIT Seats For every 500 unit increase in Total IIT Seats, the Manipal CSE cutoff shifts by approximately: 248 ranks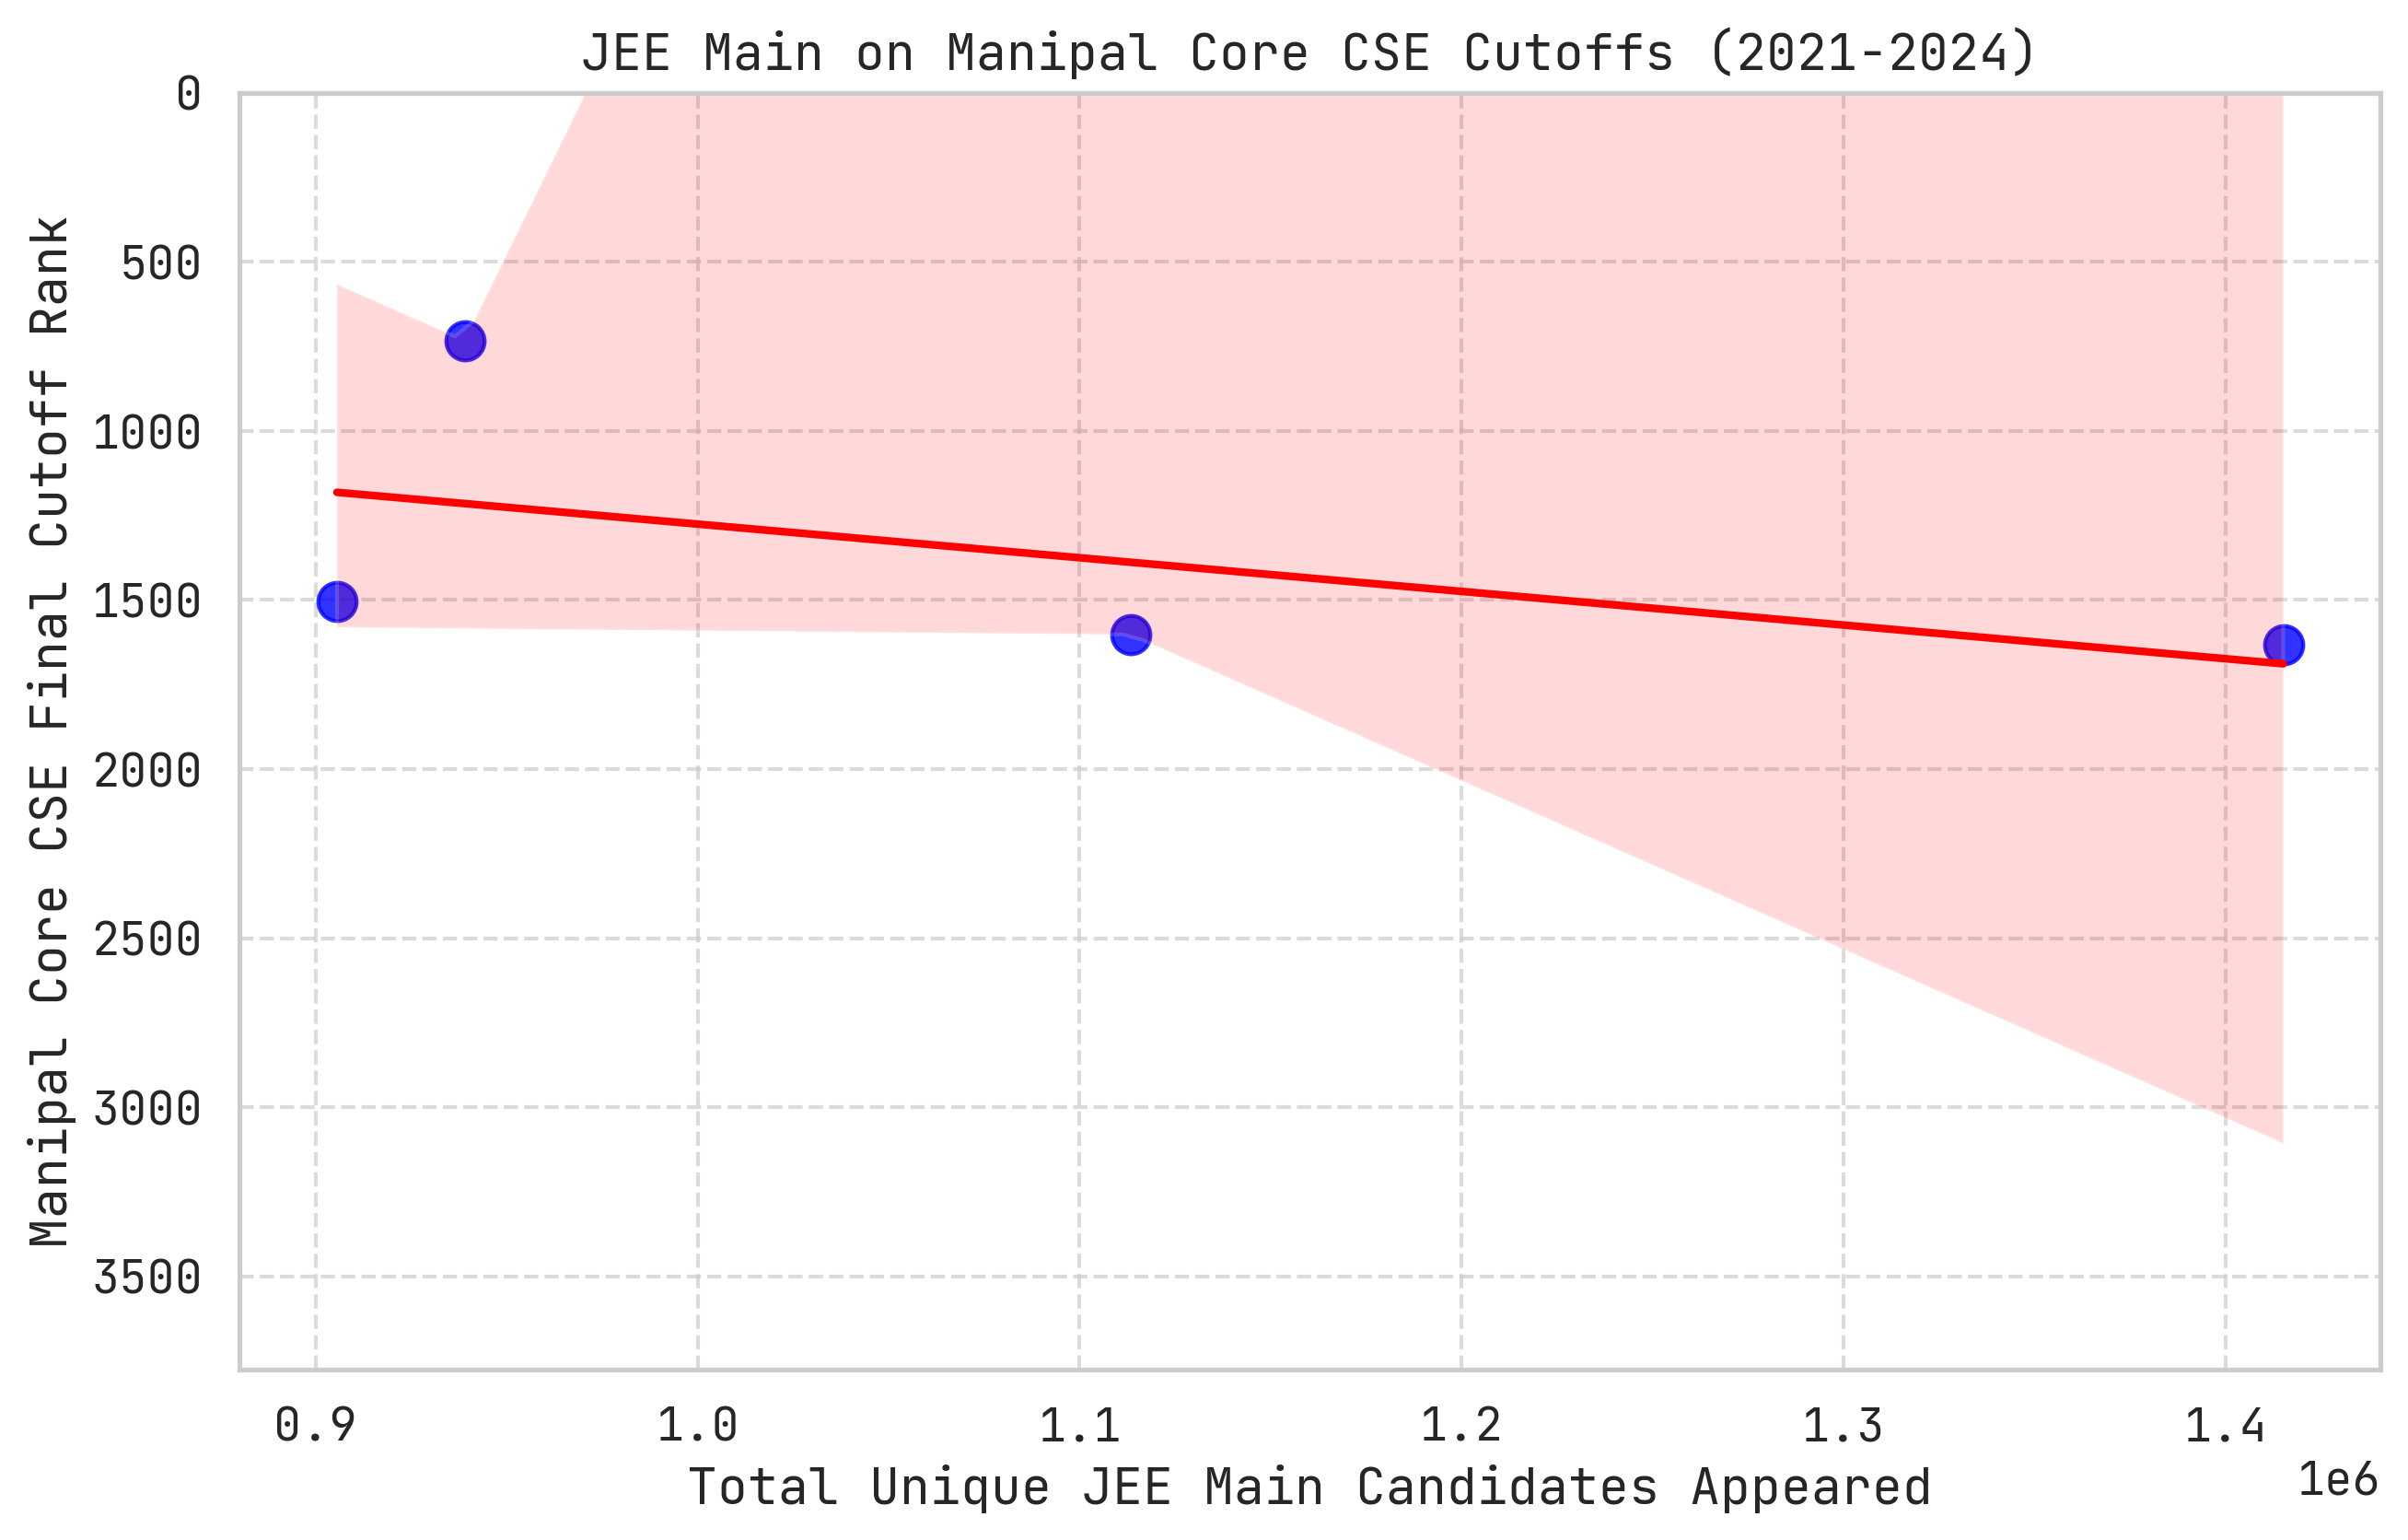
Something didn’t seem right, so I went on my way to import statsmodels API to check for OLS and see If I could derive something meaningful from it and a relation b/w all these variables.
X_multi = cse_data[['mains_appeared', 'iit_seats']]
y_multi = cse_data['final_cutoff']

X_multi = sm.add_constant(X_multi)

# Fit the OLS
multi_model = sm.OLS(y_multi, X_multi).fit()
print(multi_model.summary())

beta_0 = multi_model.params['const']
beta_1 = multi_model.params['mains_appeared']
beta_2 = multi_model.params['iit_seats']


print("\n--- Equation Variables ---")
print(f"Intercept (beta_0): {beta_0:.2f}")
print(f"Mains Appeared Coefficient (beta_1): {beta_1:.6f}")
print(f"IIT Seats Coefficient (beta_2): {beta_2:.4f}")
So the good thing is that the … is 0.851 which means Mathematically it is stating that 85.1% of the variance in the Manipal CSE cutoff is explained by two variables.
AND that’s about it cause 4 datapoints is NOT enough to make conclusions.
The uhhh p-values are 0.456 and 0.305. In statistics, we generally want these to be < = 0.05 to prove that the relationship isn’t just something I have pulled out from my ass but since it is, the major factor again is because sample size is so small, the model cannot confidently prove statistical significance.
Another thing to note is MULTICOLLINEARITY between variables which can be better explained with this site But to be brief it is because these variables are almost identical in their movement, causing the model to get confused about which variable is actually causing the cutoff to change, so maybe a better modelling and handling would be of one variable which is IIT-Seats.
While writing this, I did try this again with a single-variable and it had a far better p-value but again I feel like it is better to do this assessment now directly do this with BITSAT-scores finally than with manipal since I have records upto past 12 years.
I need to go through EDA-procedures from the hands-on-ML book again and techniques using LIME for model-interpretability or SHAP and more analysis-ideas from ISLP
Well I have to wake up for college tomorrow and it is 2AM 18/02/2026, goodnight sweethearts XO
Signing Off,
PranavU