started around: 14/2/2026
So as proposed in my writeup I promised to work on integrating external factors to make this a full-fledged machine-learning model which would take in account for the aforementioned features mentioned in the said writeup.
So… started working on JEE Mains and I CAN’T LIE THIS IS ONE OF THE MOST PAINSTAKING THING I HAVE EVER ATTEMPTED DOING. THERE ARE SO MANY FUCKING LOOPHOLES, MISSING DATA & BAD REPORT-FORMATS (in years prior to 2019)
I first started by finding the number of candidates registered for Mains exam and how many appeared in comparison, seems like an easy task doesn’t it? well for 2019+ years, yes since NTA records are more or less straightforward & concise with these matters but for pre-2019 records, I would much rather watch paint dry lowkey.
The reason why it is so FUCKING hard to find is the change of agency which conducts examination and the way they conducted it. It is essential to understand that CBSE used to conduct mostly pen-and-paper examination for JEE-mains with an option to opt-in for CBT if students wanted, and cutoff scores for JEE was determined directly by marks in accordance to your category than the percentile system that is used currently.
with NTA taking over, I believe data preservation wasn’t done properly which has led to literally no proper document for this as a result when you attempt finding and searching this directly
with no other choice, I pulled a technique which I hadn’t used since the heian-era which was well go back on wayback machine and find any possible archives which had the official documents
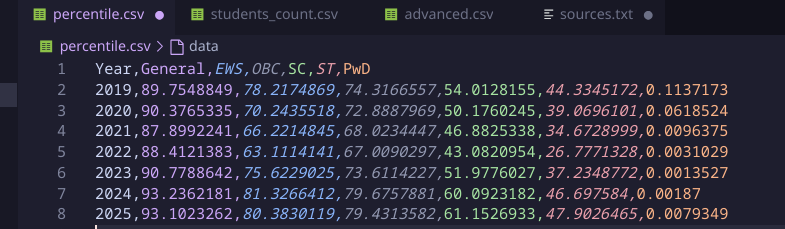
After scouring for couple of hours, finally got with these results:-
2015-record(this was more relevant comparatively and actually helped me)
rest of the data was finally sourced by “ternary-source” wikipedia but man what other choice I have? If the data is not from official-sources, I always take it with a pinch of salt, even I can source values from my ass but that don’t make it true.
I do want to state that getting latest NTA docs were no easy job since NTA has weird page-nesting and it is extremely difficult to find, so I just searched up for any “notices” on jeemain.nta.nic.in and actually managed to find success in this.
unlike JEE-Mains where the agencies don’t bother to preserve data properly, JEE advanced was a breeze to navigate in comparison, the archive is properly maintained and has data for any information that you are looking for in a well-summarised 400 page document for each year dating back to 2011.
After all this hassle, I ended up creating three separate datasets which was to respect the differences and relations each dataset had wrt one another.
As I mentioned before, this percentile/normalization was not there before since mains exam didn’t span across multiple days and shifts like how it happens now.
So there is this challenge on how to update that with respect to years dating all the way back to 2013
luckily after some digging I managed to find this
The Official NTA Formula
NTA formally defines the percentile score based on the proportion of students scoring at or below a specific candidate’s score:
The Algebraic Derivation
So If I were to use this formula, map the absolute rank to the NTA’s numerator. Let be the Total number of candidates, and be supposed Rank.
If lets say your rank is , exactly people scored strictly higher than you. Therefore, the number of people who scored equal to or lower than you is the total candidate pool minus the people ahead of you:
Substituting into the numerator of the official equation, we get:
When we split that fraction apart algebraically:
Which perfectly simplifies to:
The Large-Number Approximation
When the sample size () is astronomically large which here is like more than a million students taking the JEE Main—the value of the fraction becomes virtually zero.
Because that microscopic decimal does not impact the final structural rank, it is safely dropped to create the standard working formula for rank-to-percentile estimation:
THIS IS PARTICULARLY USEFUL TO DERIVE CAUSE NOW FROM TOTAL NUMBER OF APPEARED CANDIDATES OF A PARTICULAR YEAR AND GENERAL PROPORTION OF CANDIDATES FROM EACH CATEGORY GIVING EXAM FROM 2019-2025 TO GENERALISE CAN ACTUALLY HELP FILL THIS MISSING VALUES FROM 2013-2018!!!
Now it is actually 4:30 AM 15/02/2026 when I am writing this and I am kindof tired after doing all this excavation of data.
There is still so much to do and I lowkey need a DS-ML mentor at the moment who can guide me to linking these features to BITSAT cause I have no idea what I am really doing lmao.
I have curated MET-cutoff ranks from 2021-2025 so I could experiment this on that dataset to find the impact of JEE-mains and even advanced to possibly affect cutoffs of those years (and this is a lot better since data post-2019, if I haven’t stressed enough already is more reliable than pre-2019)
Alright that’s enough of me for today, gn sweethearts!! XO
Signing Off,
PranavU